Not Your Average Console: 10 Features You (Probably) Didn’t Know About Your WS-2000 and WS-5000 Console
Are you an Ambient Weather WS-2000 or WS-5000 station owner? If so, chances are you already know the importance and convenience of having one. But did you know that your display console can do more than take indoor readings and display a forecast? There are a variety of exciting ways to get even more use out of your device – from creating personalized charts to managing your weather data history. The best part about an Ambient Weather console is you don't have to pay a subscription to view, analyze or manage your data. In this blog post, we'll explore ten things you can do with your console to gain a new level of functionality!
1. View Min/Max Measures
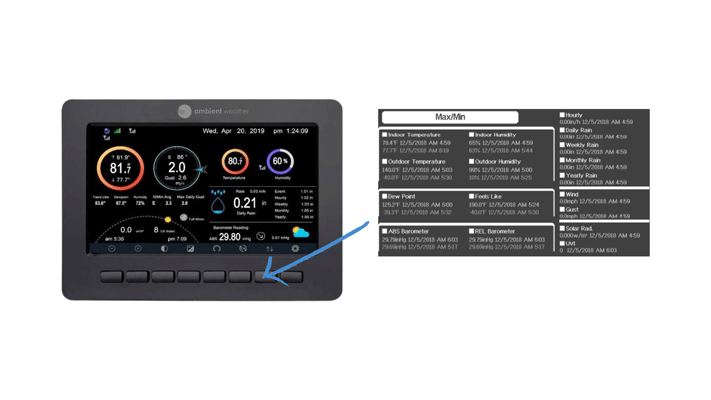
View high and low records and clear specific records in History Mode (second button from right on console). Review your min/max data for any parameter collected from your weather station array and indoor sensors. This mode is ideal for tracking long-term trends in your house or backyard.
Many choose to clear their data once a year to get a full year's perspective on their min and max measurements, or some wish to clear it daily. You can program your console in settings to clear all minimum and maximum values at midnight every day.
2. Archive Your Memory
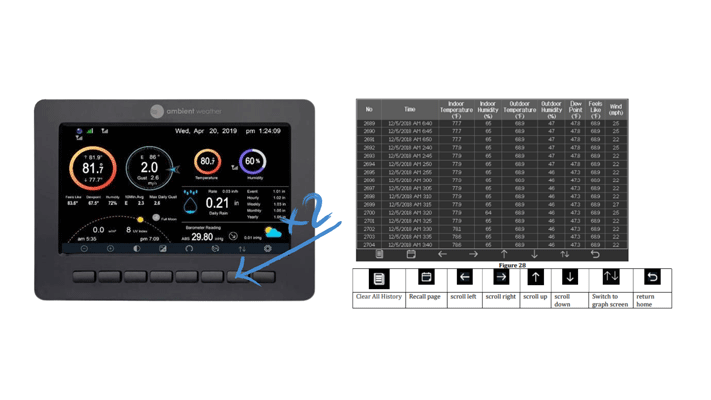
You can view time-stamped logs of the data stored on your console from 1 to 240 min intervals and clear archived memory from the Archive Memory Mode. Simply hit the History Mode button twice (second button from right). This function is great for quick access to your data or for documenting weather trends, making it easier to draw conclusions about your environment.
3. Program Your Backlight Display
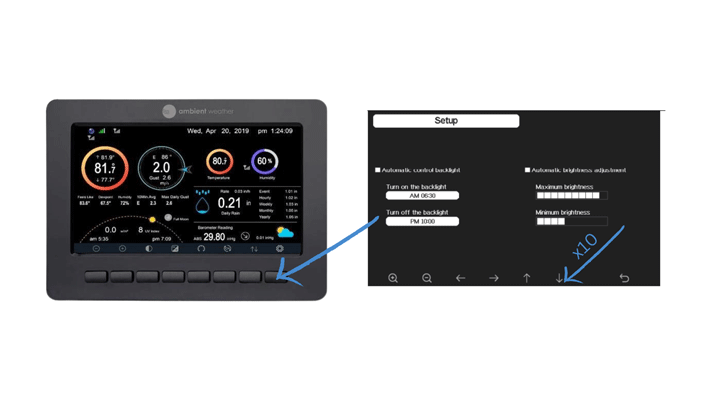
Automatically turn on and off the backlight or adjust the brightness based on the time of day. Set your backlight to turn on in the morning and off at night when you go to sleep. Select the Settings button (last button on your right) and then select the down arrow 10 times to reach the backlight settings.
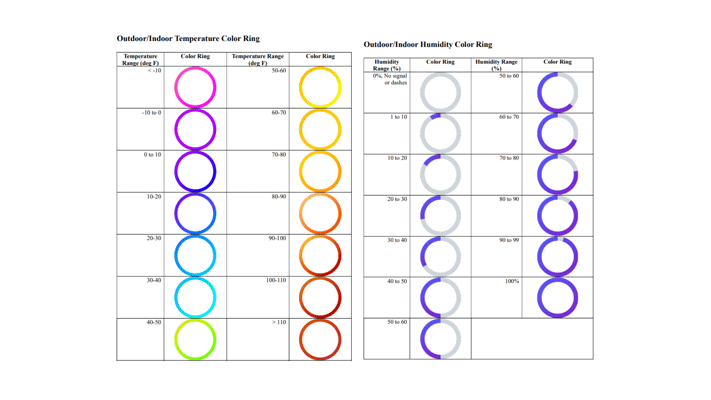
4. View Temperature and Humidity at a Glance with Color Rings
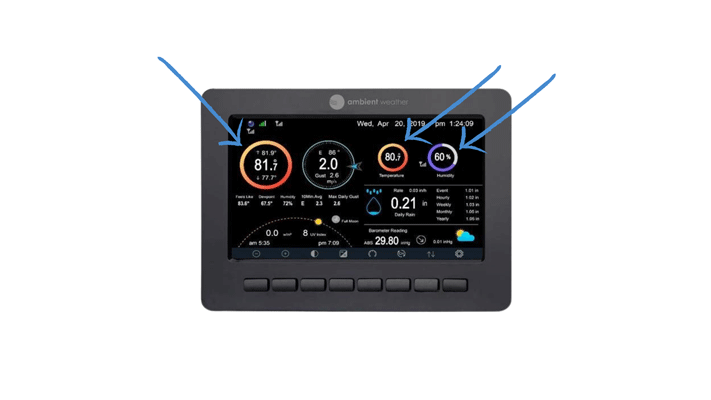
For Indoor, Outdoor, and optional Channels 1-8, quickly view your temperature and humidity at a glance with the bright and colorful gradient rings. This is handy if you want to quickly gauge how warm (or cold) it is outside or if your indoor climate has enough humidity. You can easily identify changes in weather conditions with these color-coded alerts.
5. Check Your Hourly Rain Icon
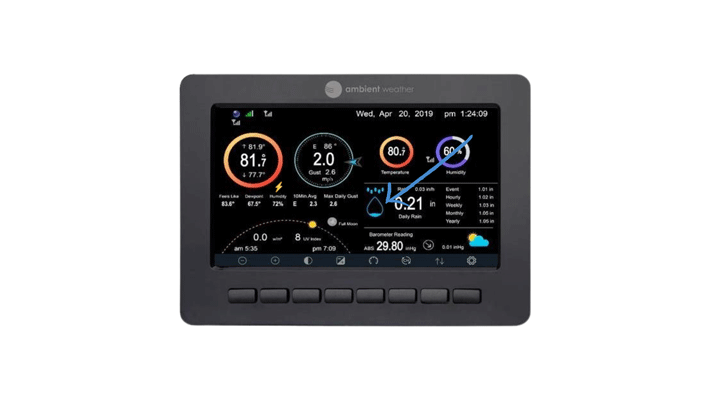
The Hourly Rainfall Icon shows the accumulated rainfall for the last hour (60 mins). The console stores the rainfall every 5 minutes and displays the sum of the previous 12 measurements (trailing 60-minute summary). This is an ideal way to keep track of the amount of precipitation for a specific location, allowing you to be aware of sporadic weather events like light showers or downpours.
6. Know When a Lightning Storm is Approaching
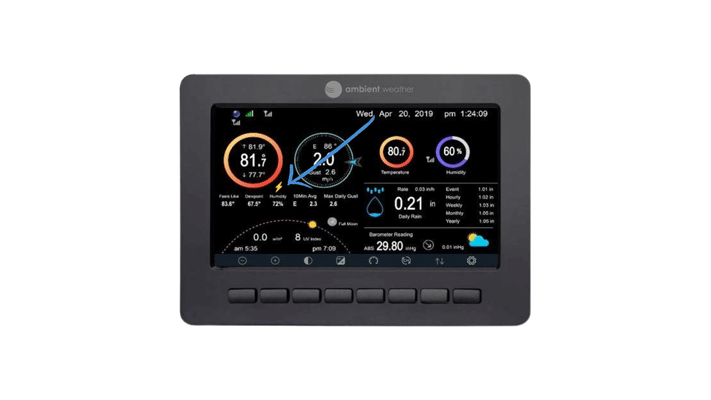
The lightning icon appears when the Dew Point exceeds 70 ºF, which signifies temperature and humidity conditions may be possible for lightning storms to form in the area. Knowing when these conditions are present allows you to be more aware of the weather in your area and can help reduce exposure to severe storms.
7. View Your External Sensors: Soil Moisture, Lightning, Leak
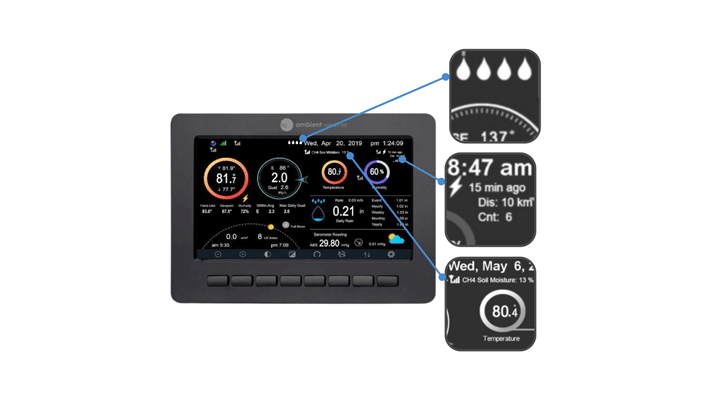
The innovative Ambient Weather console can access data from external sensors wirelessly connected to it. You can monitor soil moisture for gardening purposes, detect lightning storms, and find out if there's a leak in your home. With this feature, you have a complete home monitoring system.
- Leak detector channels 1-4 will show up as droplets on the left of the date. You can add up to four WH31LA Leak Detectors and monitor their status simultaneously.
- Lightning detector status will display right under the time in the top right. The console will provide the last strike time, distance, and strikes per hour. You can add one WH31L Lightning Detector to your console.
- Soil Moisture channels 1-8 will be displayed above indoor temperature, showing the moisture content percentage for up to eight WH31SM Soil Moisture Sensors.
8. Analyze Data Graphs
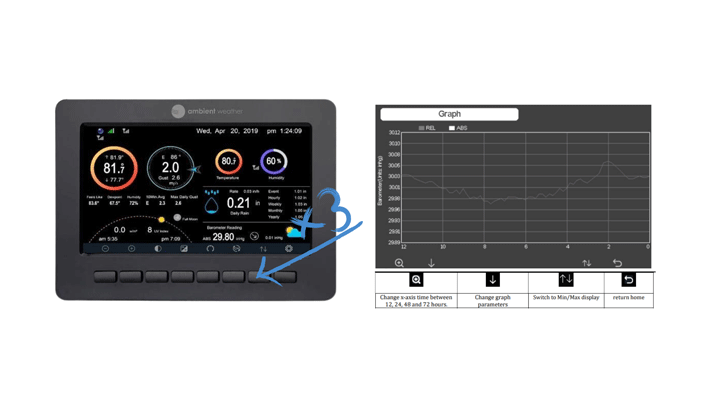
View graphs for all parameters for the past 12-72 hours by pressing the History Mode button 3 times. You can also compare data points to see how they have changed over time. This feature makes it easier for you to track weather conditions and make informed decisions based on data visualization.
9. Multi-Channel and Scroll Mode for Thermo-Hygrometer Sensors
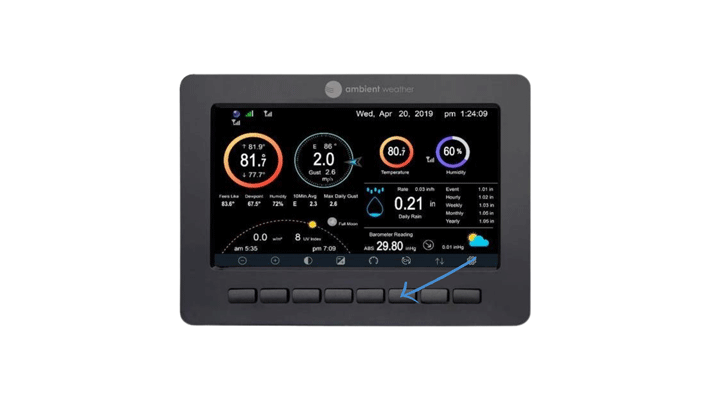
The Ambient Weather Console can display data from up to eight thermo-hygrometer sensors simultaneously. It also has a scroll mode, enabling you to view the readings of all channels one by one. This feature makes monitoring different environments and their temperatures and humidity levels easier. Press the Channel Button (third button from right) to switch between indoor and outdoor channels 1-8. After the last channel is selected, press the Channel button one more time to scroll all the sensors every 5 seconds. You can also label each sensor for easier viewing under the Settings button.
10. View Your Air Quality
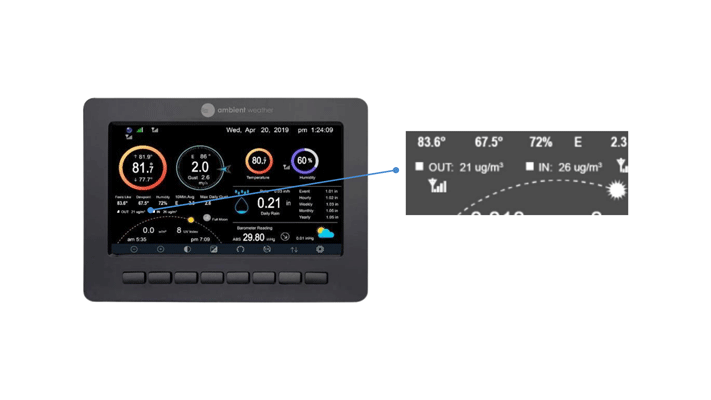
Suppose you own our PM25 Outdoor Particulate Monitor and PM25IN indoor Particulate Monitor. In that case, the display shows the current PM2.5 measurement and the 24-hour running average, which is a better indication of the accumulative effect of particulates on overall health. The display features a color-coded icon above the sun arc with the following breakpoints (ug/m3):
Good: Green 0.0 – 12.0
Moderate: Yellow 12.1 – 35.4
Unhealthy for Sensitive Groups: Orange 35.5 – 55.4
Unhealthy: Red 55.5 – 150.4
Very Unhealthy: Purple 150.5 – 250.4
Hazardous: Maroon 250.5 – 500


-
 How to Monitor Air Quality to Reduce Allergy Symptoms
-
 Ambient Weather Network Now Supports Up to 16 Soil Moisture Sensors—Here's What That Means for You
-
 What Is SKYWARN? How Trained Storm Spotters Support Severe Weather Safety
-
 Embrace the Spring with AWN: Your Weather, Everywhere
-
 Your Weather, Your Way: Introducing Enhanced Dashboard Organization on AWN+